


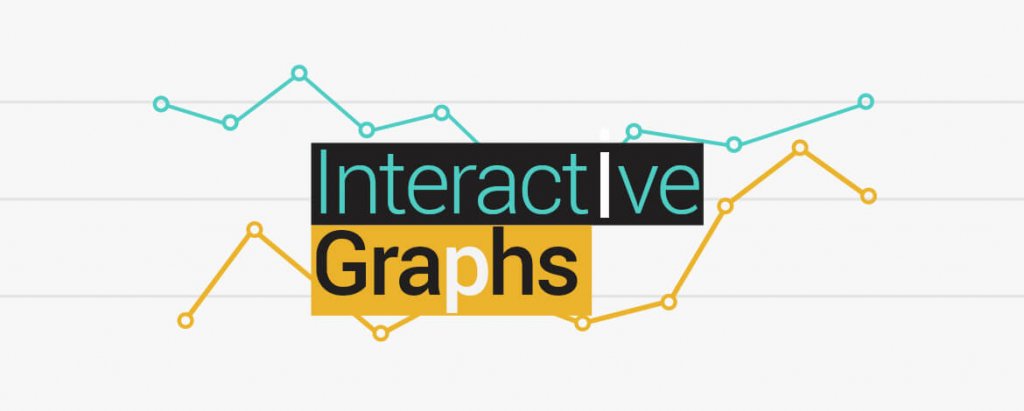
Uplers have been working hard to get the best for marketers.The keenness to come up with heavenly ideas has reaped benefits to a lot of them. One such idea to help the marketers present their information is through an interactive graph. These graphs can help presenting a data in interactive and informative way.
Advantages of using interactive graphs
- Summarizing a huge data
Interactive graphs are visually attractive and can grab a lot of attention if added in an email. It can be useful to summarize a huge data with complex numbers. It can also help create various reports or data forecasting.
- Visualize the Specifics
At times it is difficult to put down the specifics in a script. A graphical representation can showcase your ideas in such a way that they are easily read & understood.


- Highlighting the Key Point
An email stuffed with a lot of content tends to lose its importance. Thus, it is necessary to grab the viewers’ attention and engage them. An interactive graph can be useful here by highlighting the key points. It will grab the viewers’ attention at one go and the precise info can be transferred.
- Graphs can be Credible
Sounds Weird? It’s a human tendency to look at an image first followed by the text. If some information is presented with the help of a graph or in any visual form, it’s likely that readers will look and analyze the graph immediately.
Limitations of having an interactive graph
There are no major limitations when adding an interactive chart in an emailer. While the bar graph is most suitable and suggested graph which creates no issues across all platforms, application of line graphs and pie charts can get a bit tricky. It is difficult to create the fall back for these graphs.

Samples
Get sample email to experience the feel of an Interactive Graph in your inbox


Compatibility
The interactive graphs are compatible with almost all the platforms. Outlook and Lotus are two platforms where the graphs would be legible but the animation might go missing.
Application
- Research companies who want to share various data and findings held by them.
- Manufacturing companieswho want to share their annual report outcomes with their shareholders.
- Educational institutes that wants to share their previous achievements and placement records.
- Food and Beverage companies that wants to compare their nutrients with their competitors.
- E-commerce websites who want to compare the features of various products
Various other industries that can take the help of interactive graphs to provide certain information