So you have built a sturdy product or service that is all the rage amongst the target audience; you have run your ads, kickstarted a mindblowing email campaign, and have now decided to rest easy. But wait, are you celebrating too early? Pause and reflect!
People just don’t get up in the morning and start adding stuff to their carts. The buyer’s journey is a sinuous one and definitely not a linear experience, irrespective of how tantalizing or irresistible your product might be. Unless you explore interactions at every customer touchpoint, the desire to get your metrics and, ultimately, ROIs right may never materialize!
To begin with, let’s get the differences between the customer and buyer journey crystal clear. The buyer’s journey is a more generic term that includes the entire process, from identifying a pain point to considering available options, evaluating, and finally signing up to become a product or service subscriber.
On the other hand, the consumer journey refers to the touchpoints at which your brand comes up in the journey of identifying pain points, evaluating options at hand, zeroing in on brands that offer premium deliverables, and finally purchasing the best and most suitable product or service.
When you measure and analyze the journey at hand, you can craft better strategies. This is where Hubspot Consumer Journey Reports come into play in analyzing nonlinear consumer journeys. Let’s understand how one can deploy this fantastic tool in enhancing consumers’ journey.
Step By Step Ways To Deploy Customer Journey Analytics In Enhancing The Whole Consumer Experience
1. Set your goals: Before you proceed toward creating customer journey reports, you must have a clear understanding of your basic goals. Once you know your end goal, which might be an escalation in sales, or see which HubSpot templates work best, enhanced customer satisfaction, etc., you can use HubSpot Customer Journey Analytics to get closer to that goal with a detailed report on your current journey.
2. Define your current path: Once the goals are well-defined, it becomes easier to populate your content path with a series of steps or interactions that your customers are expected to traverse before making a purchase. These interactions can include steps like visiting a website, filling in the details on a form, checking in for a demo, and finally zeroing in on a product for purchase.
If you use Hubspot as your preferred CRM tool, you have the option of creating Reports to track life-cycle stages under the “Customer Journey Reports” section. Simply said, events or steps are interactions that contacts have with your brand.
3. Begin tracking your customer journey: Since you have now set up your content path, you can now begin tracking your customers’ journey through various touchpoints, such as their landing page experience and the decision to add to cart a product and checkout. This will help you get a clearer understanding of every consumer interaction and zero in on areas that can be improved.
4. Analyze data & work on making improvements: The reports will reveal a whole new arena of insights that one can work on to better understand how your email marketing campaigns rub off on your target audience. This will help you identify steps where customers are most likely to drop out, and then you can take the necessary rectifying measures to retain them better.
5. Test, test, and test some more! Once you are done with incorporating the requisite changes, run those reports again and test your systems. There is always room for improvement, so keep those polishing tools up and running!
Now, let’s hit the throttle and start compiling those reports!
Steps to Create a Customer Journey Report in Hubspot
1. Open your HubSpot account and navigate to the Reports section and click “Reports.”
2. Towards the upper right corner, choose “Create Report”.
3. Go to the Build from Scratch section and choose Journey Reports.
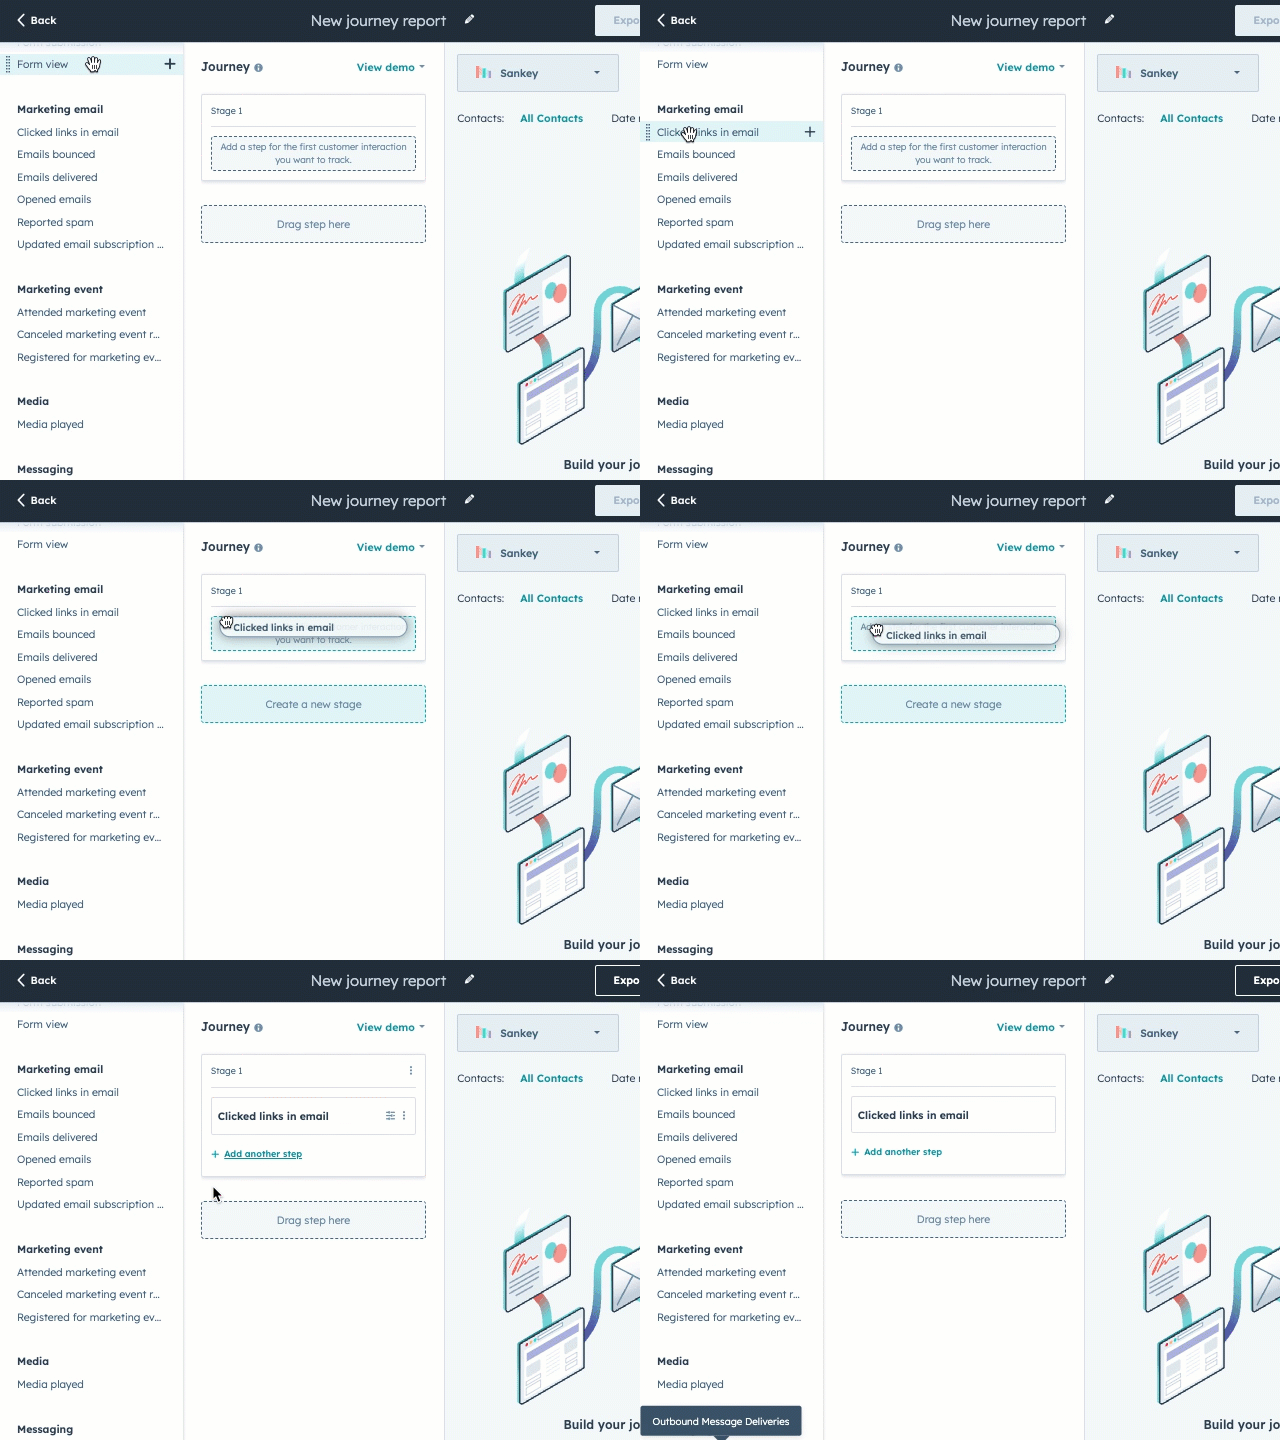
4. Over the left panel, you will see steps or events such as “emails bounced,” “emails delivered,” etc. You can click and drop up to seven such steps to work up to a conversion point or goal.
5. For the filterable properties, you can set filters by clicking on the “Filter” icon.
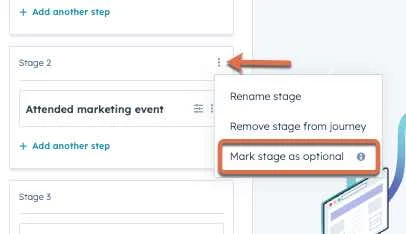
6. To add layers and depth to your report, you can choose to add branches or make the stages optional.
7. When you mark a stage as optional, the contact will not have to go through a specifically chosen stage. If the contact makes it to the end, they will be a part of the total conversion rate.
However, the first or the last stage cannot be marked as optional.
8. Once you are done with configuring your events and are ready to digest the data, you are ready to hit Run Report. You can set filters on Contacts and Date Range to get a customized report.
9. You can click “Save Report” and view either cumulative conversion rates or total conversion rates.
Cumulative conversion rates are inclusive of contacts that have gone through every stage. On the contrary, total conversion rates are indicative of how many contacts have gone from the first stage to the last stage, where they could have skipped stages.
Summary
There is a whole repertoire of common property filters to employ in your customer journey analytics report. Whether you are talking about Ads, CTAs, Forms, Deals, Sequences, etc., you can choose any of them to your Hubspot account and populate your results accordingly. If you are looking to amp up your marketing campaigns, Email Uplers is a perfect choice; replete with professionals who are equipped with the best tools and expertise to give your business the edge it needs!


Naina Sandhir
Latest posts by Naina Sandhir (see all)
Stunning Mailchimp landing page design ideas that will leave your audience floored!
4 Ways to Create a Successful Customer-centric Organization with Salesforce Marketing Cloud